Sales by service
Which services, styles and add-ons bring in the money
The sales by service report shows where your money comes from across your menu. It tells you which services, styles and add-ons earn the most, so you can price and promote with a clear head.
In this article
- What this shows you
- What each column means
- See the breakdown
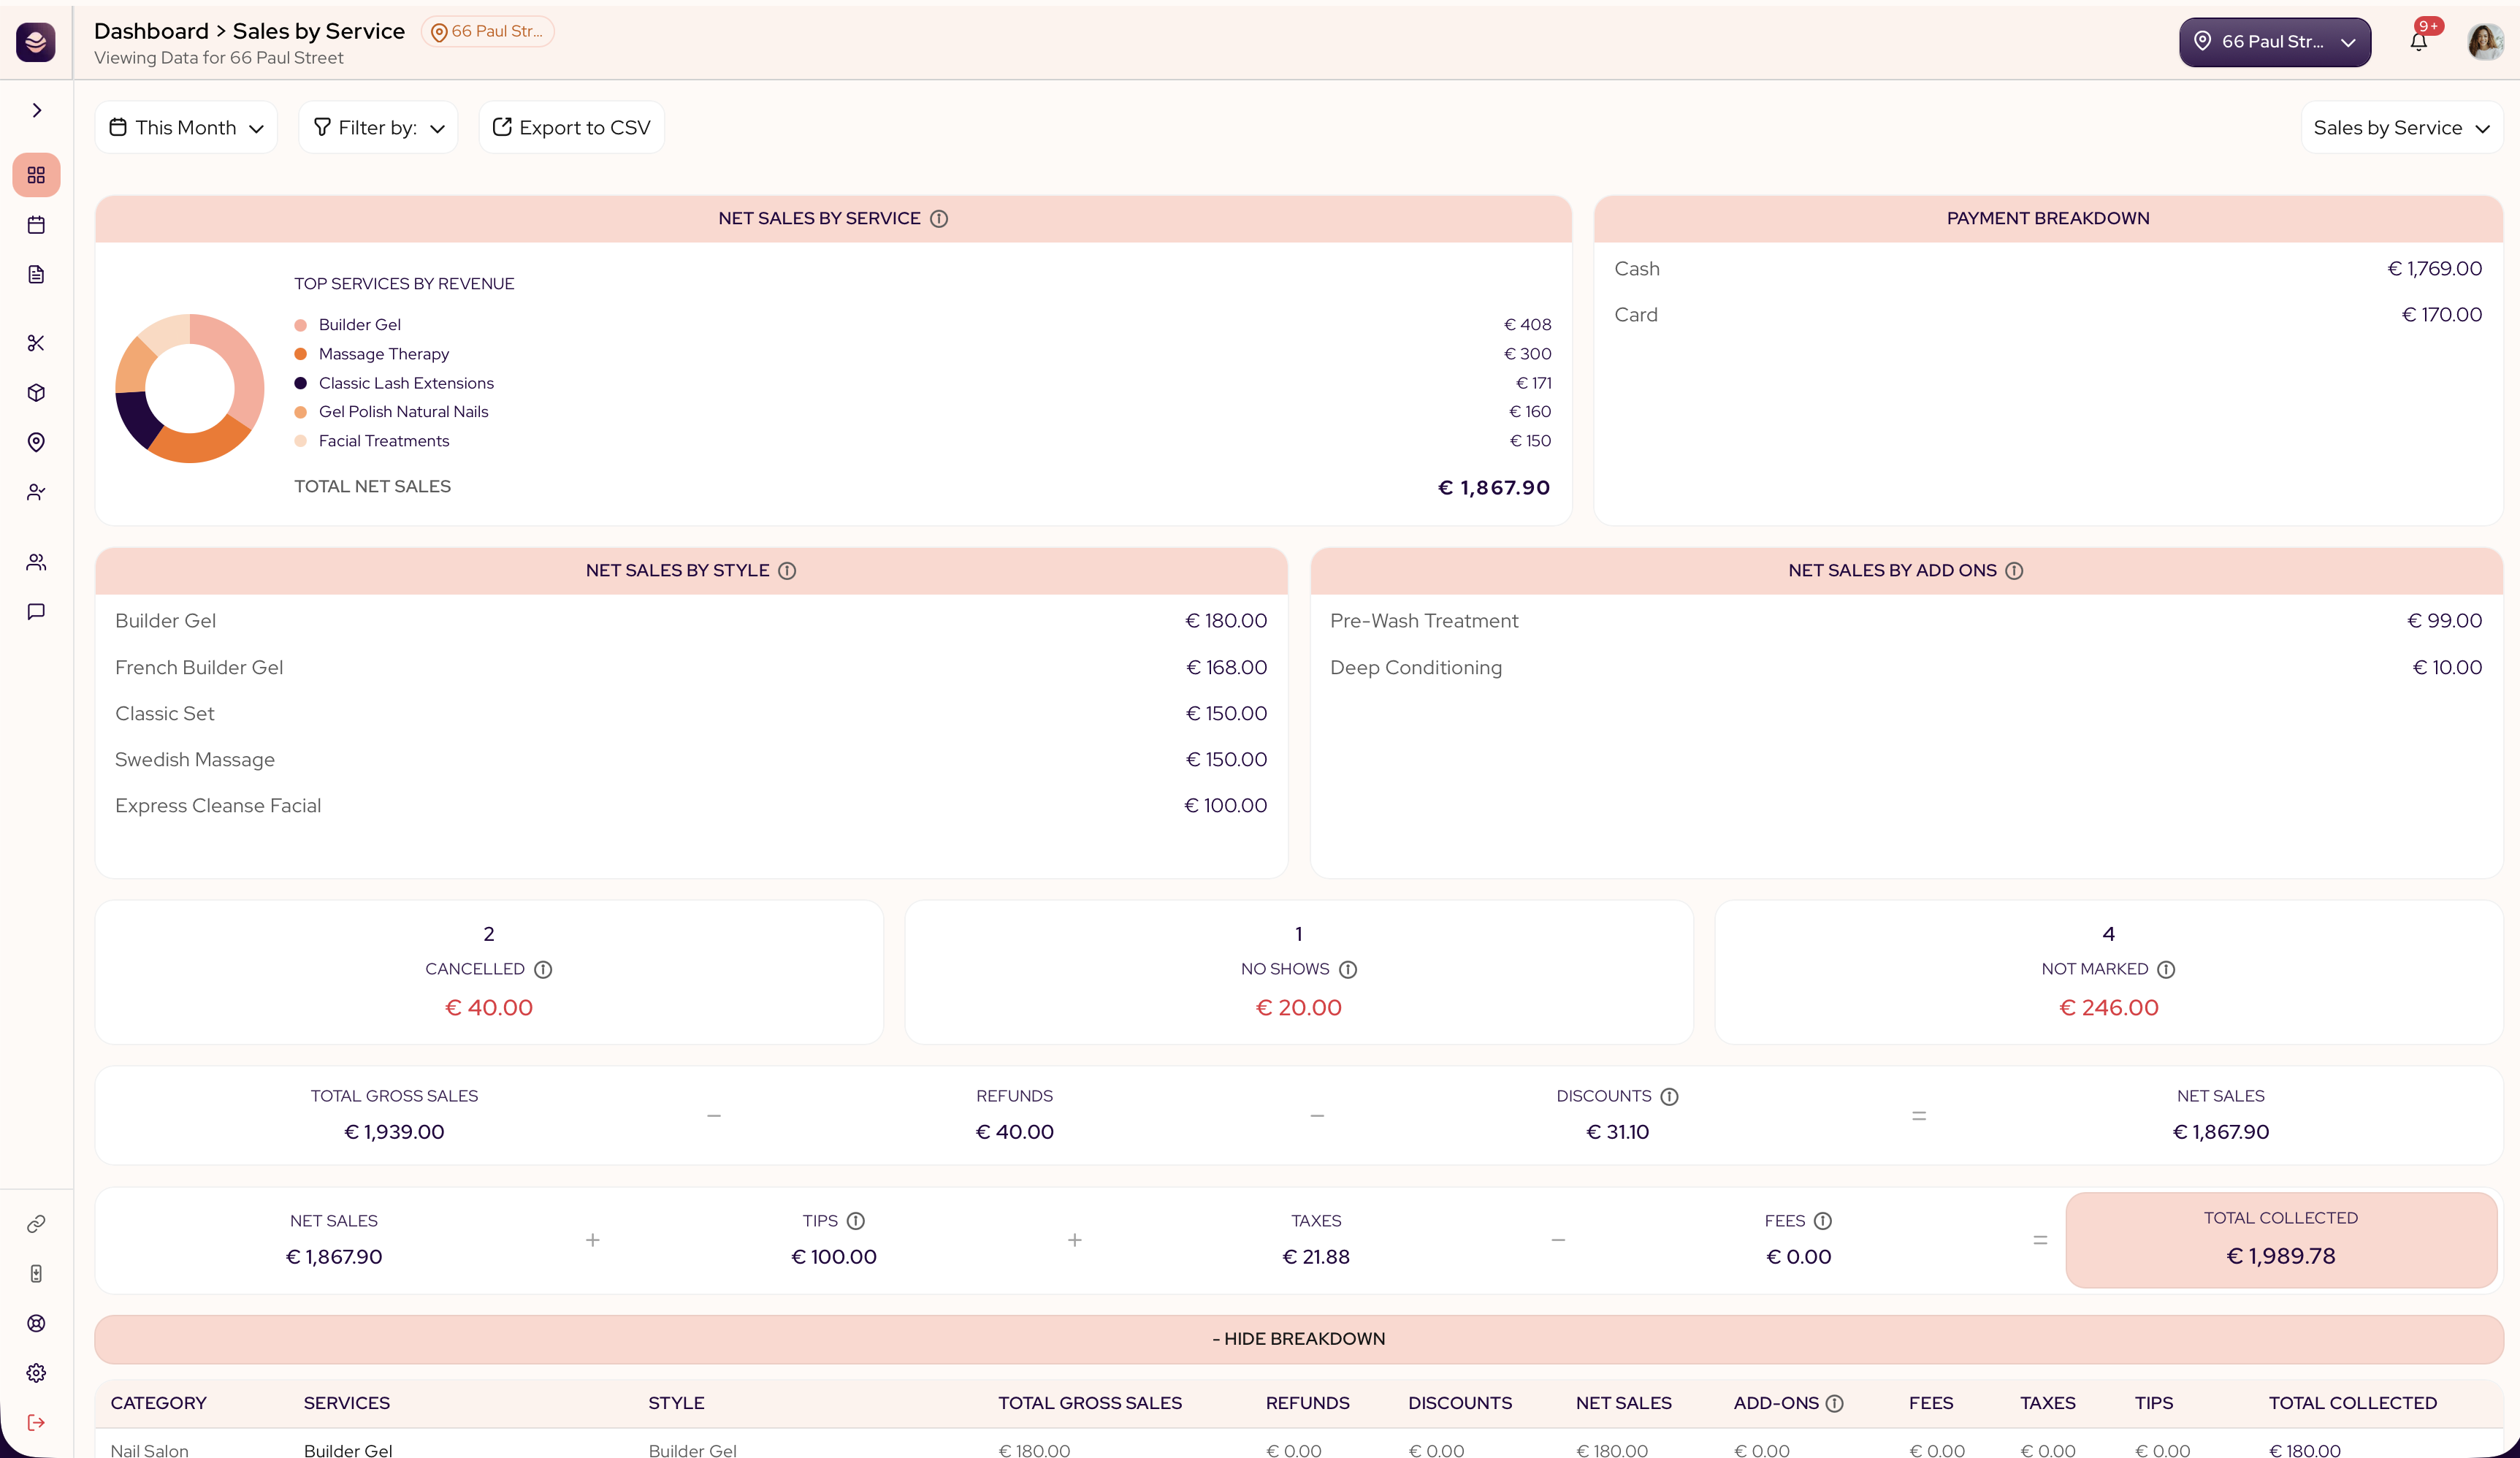
What this shows you
The report breaks your takings down by service, and a few panels sit on top:
- Net sales by service ranks your services by what they brought in.
- Net sales by style shows your top styles by revenue.
- Net sales by add-ons shows your top add-ons by revenue.
- Payment breakdown shows how clients paid.
What each column means
- Services is the service name.
- Total gross sales is everything that service took before refunds, discounts and fees.
- Refunds is money given back on that service.
- Discounts is the price taken off, including promotions and loyalty rewards.
- Net sales is what is left after refunds and discounts.
- Fees is the card processing cost.
- Taxes is tax collected on top.
- Tips is what clients added.
- Total addons is the value of add-ons sold with the service.
- Total collected is the money that reached you for that service.
See the breakdown
Select + Show breakdown on a service to open its styles and add-ons. This is where your structured menu pays off, because you can see exactly which style of a service earns the most.
Tip: Look at net sales, not gross. A popular service with heavy discounts can earn less than a quieter one at full price.